Climate Change Explorer
Explore projections, compare scenarios and simulate climate change impacts on Chilean watersheds.
Explore projections, compare scenarios and simulate climate change impacts on Chilean watersheds.

Climate Change Explorer is a web platform focused on analyzing future climate change impacts at the watershed scale. It allows users to explore climate projections, compare scenarios, assess changes in key variables and use thematic simulators to support planning, risk assessment and decision-making.
It was designed for organizations that need to go beyond data visualization and have an applied, clear and flexible platform to analyze possible climate futures in Chile.
Climate data exists, but reaching actionable results is slow, expensive and requires specialized teams. Most organizations end up with static reports that become outdated within weeks.
Without the platform
With Climate Change Explorer
Analyze future changes in precipitation, temperature, evapotranspiration, runoff and drought metrics.
Contrast different scenarios and evaluate differences in magnitude, uncertainty, robustness and risk.
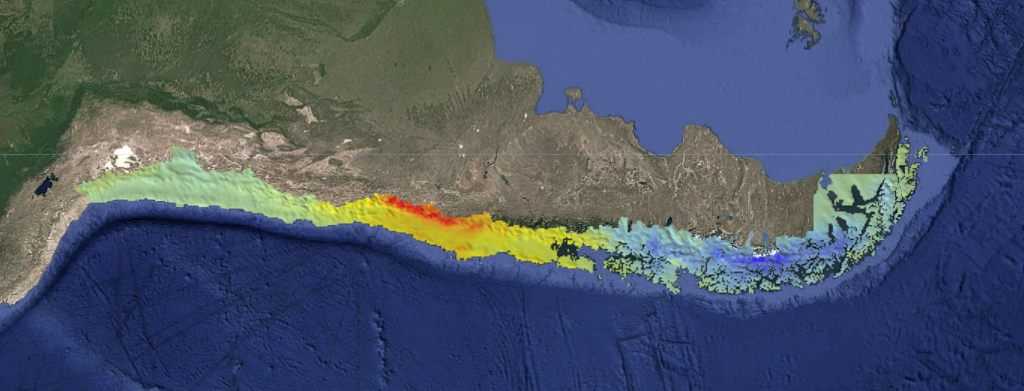
Identify watersheds with larger projected changes or distinct climate trajectories.
Use thematic modules to support applied analyses and impact assessments.

Clear, exportable visualizations ready to communicate results.
Quick walkthrough of the platform
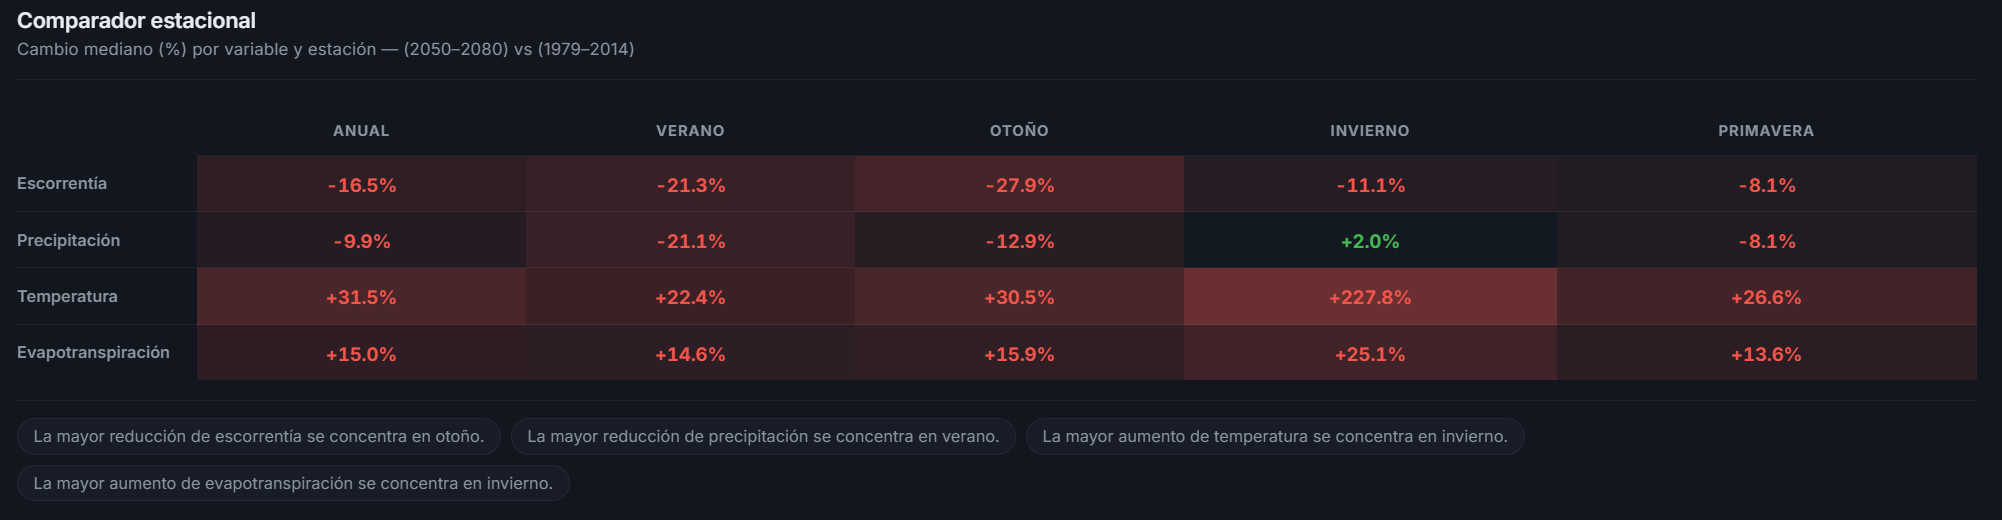
Contrast climate behavior across seasons and detect the time windows where projected changes concentrate.
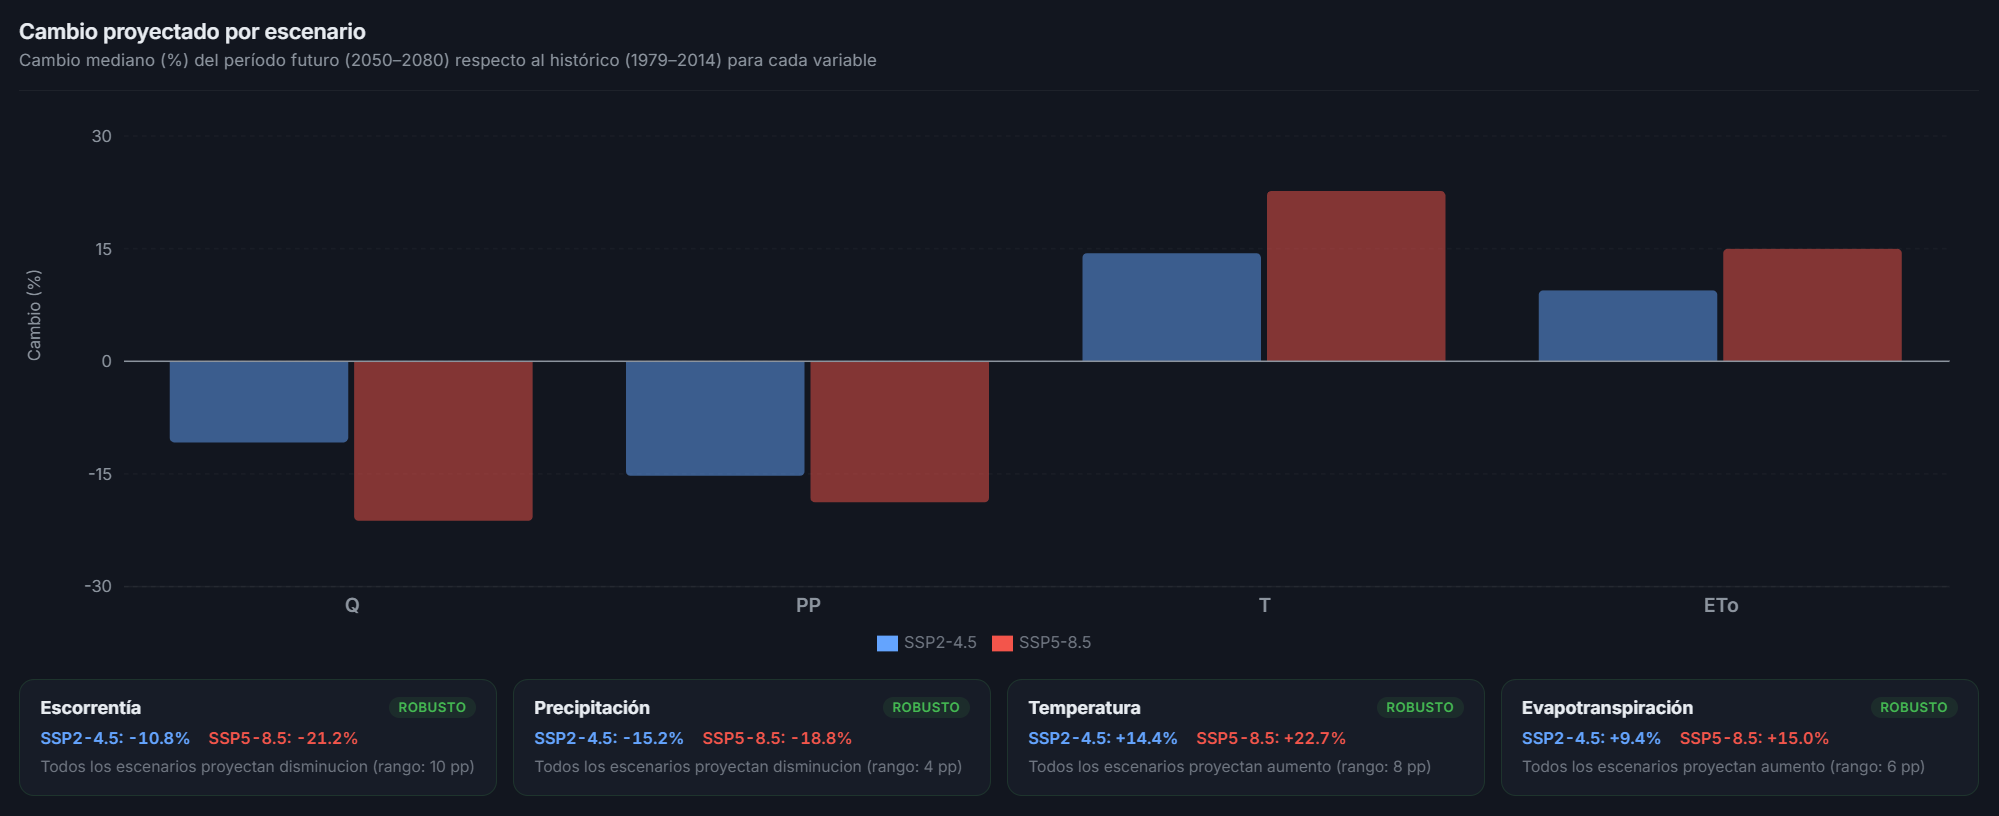
Compare SSP scenarios side by side to understand the magnitude and uncertainty of climate change in your watershed.
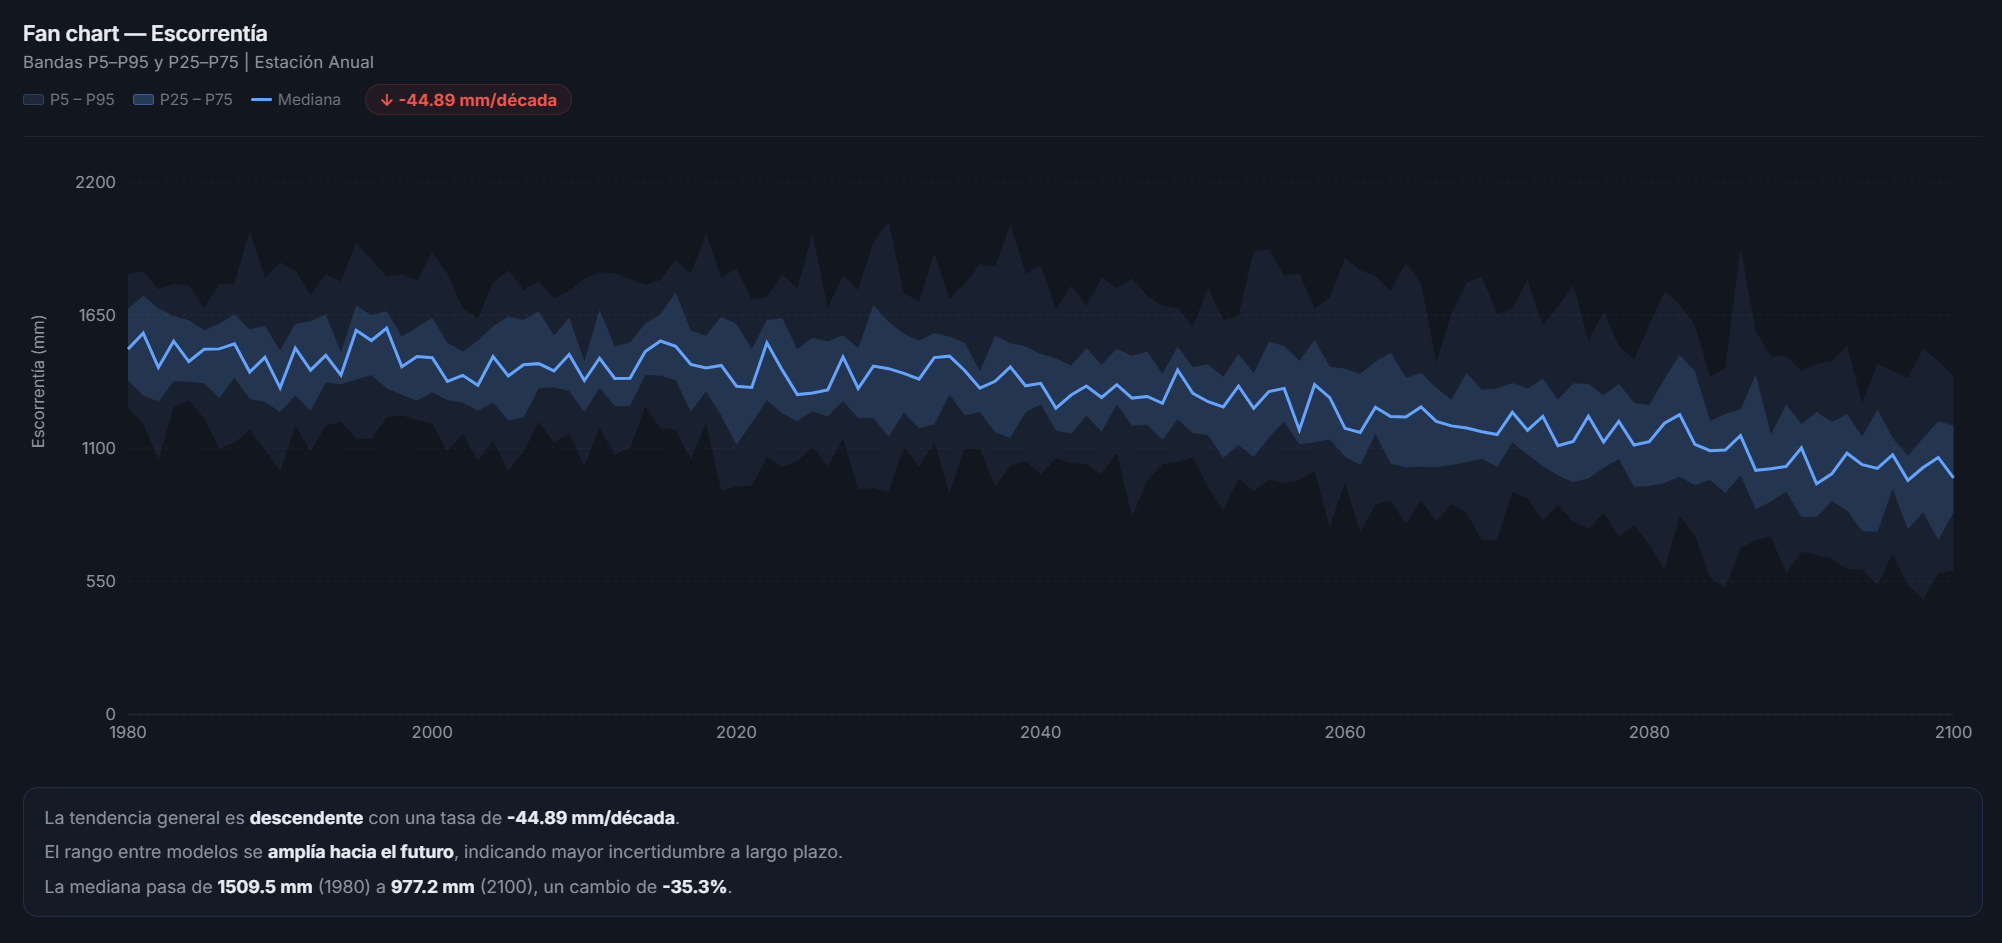
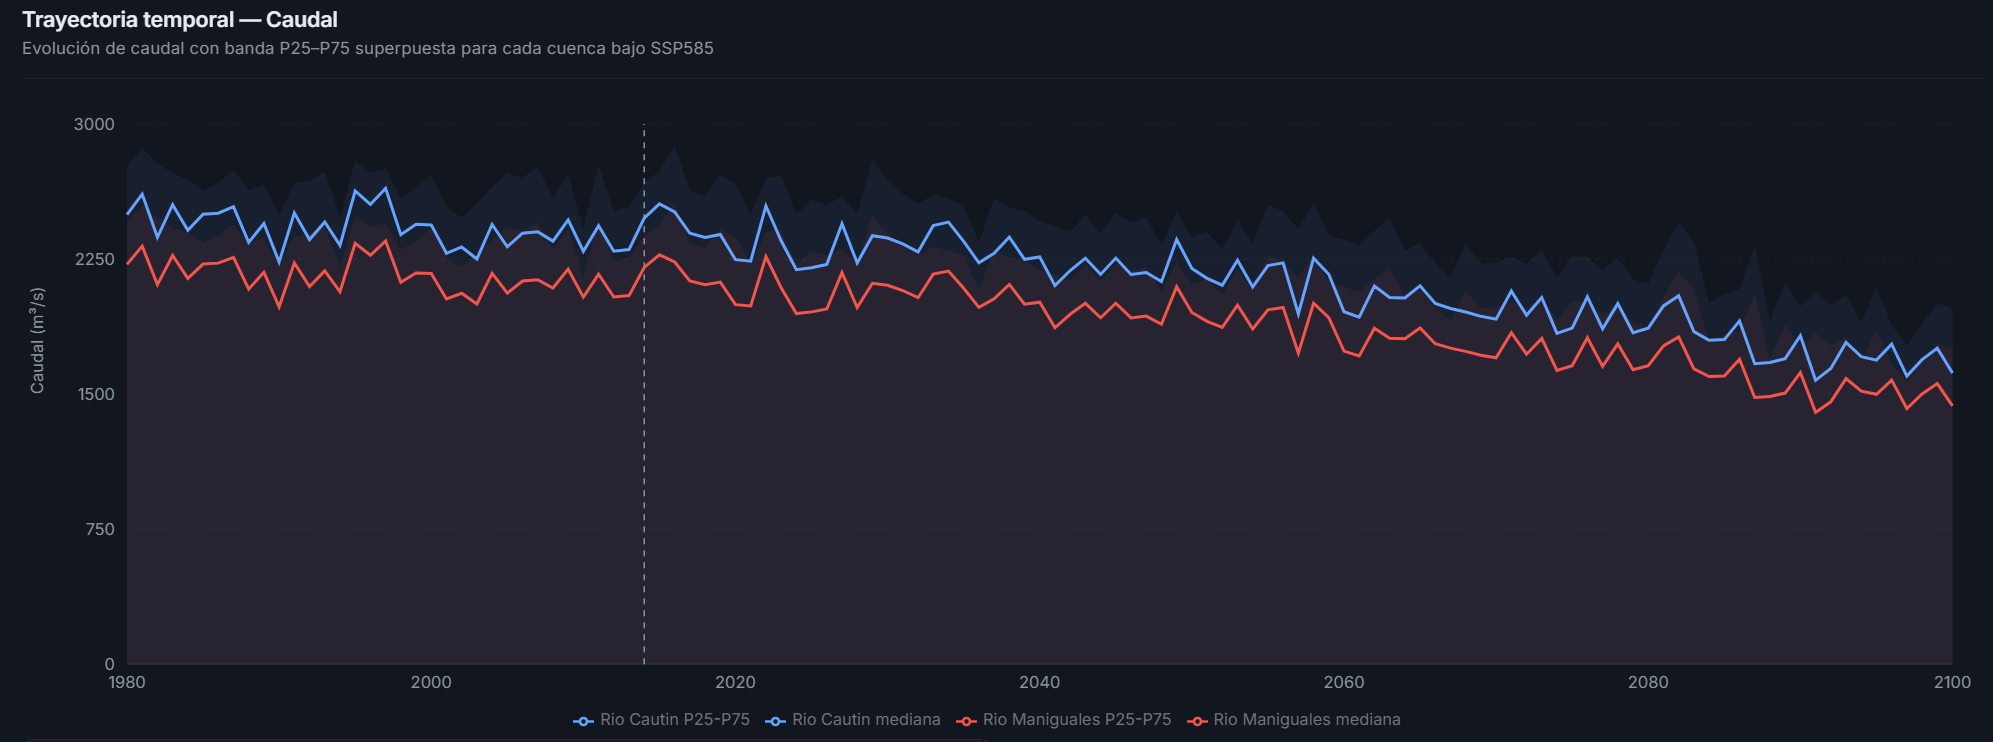
Time series with decadal trends and significant changes for key hydrological variables such as runoff, precipitation and temperature.
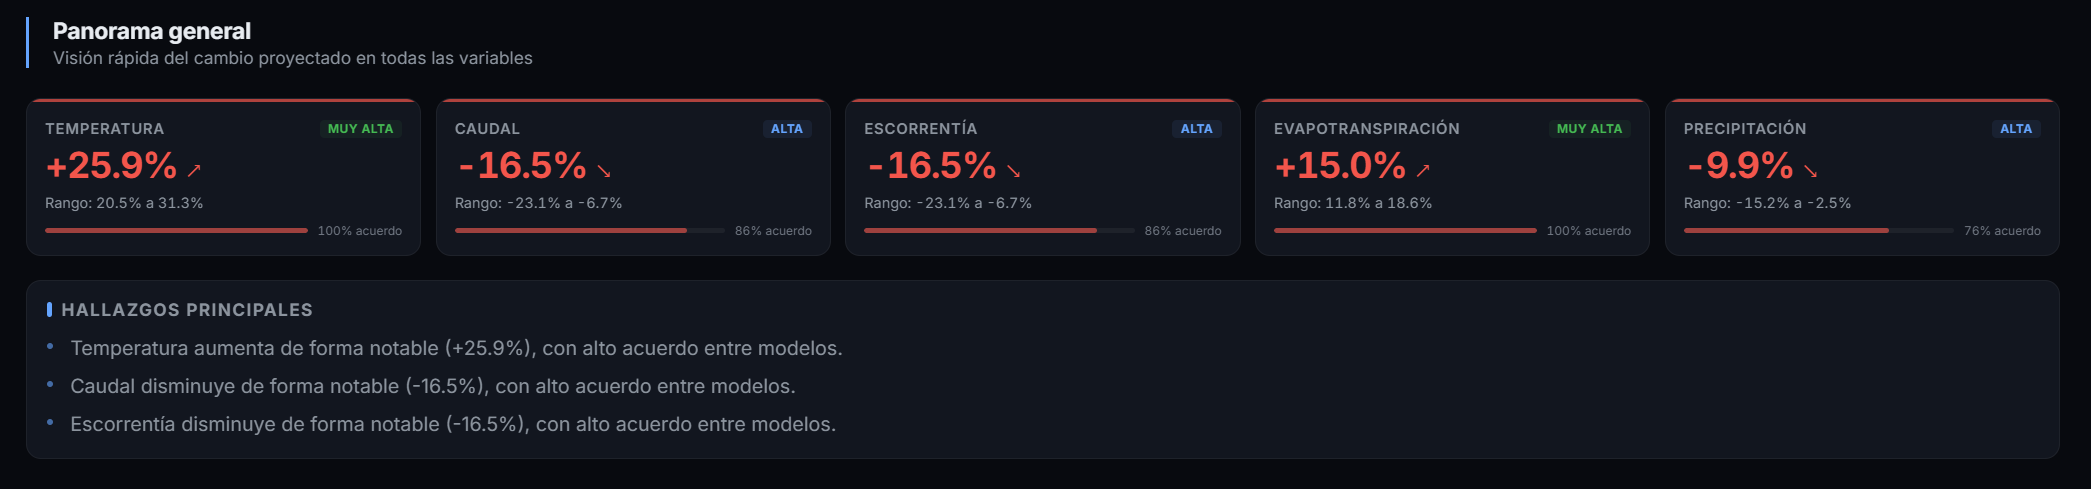
A consolidated view with the most relevant climate and hydrological indicators for the selected watershed.
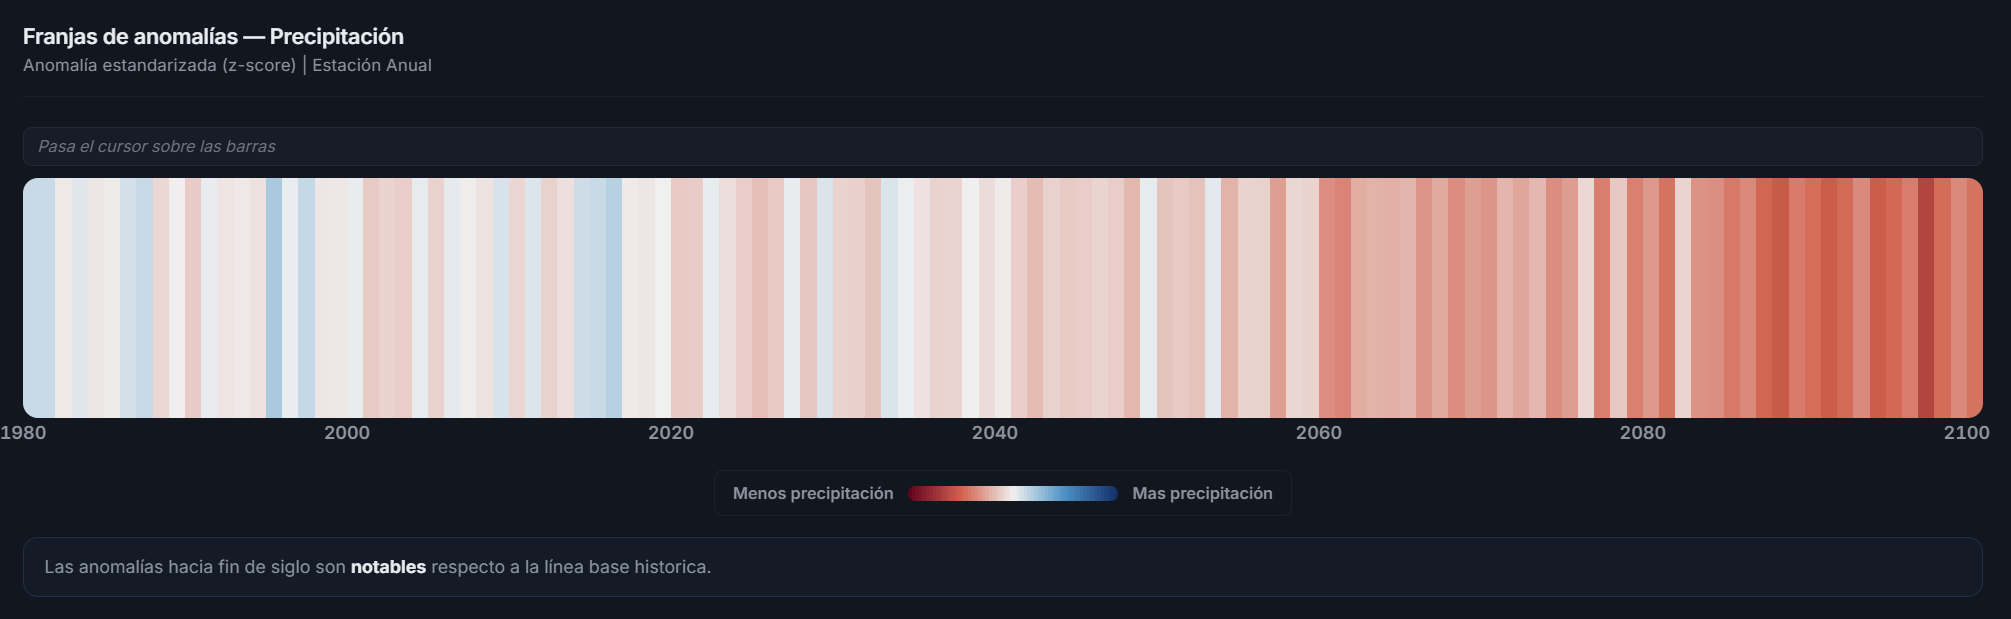
Quantify deviations from the reference period and visualize dry and wet years in historical and projected perspective.
Visualize climate trajectories from different SSP scenarios on a common timeline to measure future divergence.
Contrast different watersheds side by side to identify where projected changes are most intense or diverge significantly.
Thematic tools to translate climate projections into directly actionable impact indicators.
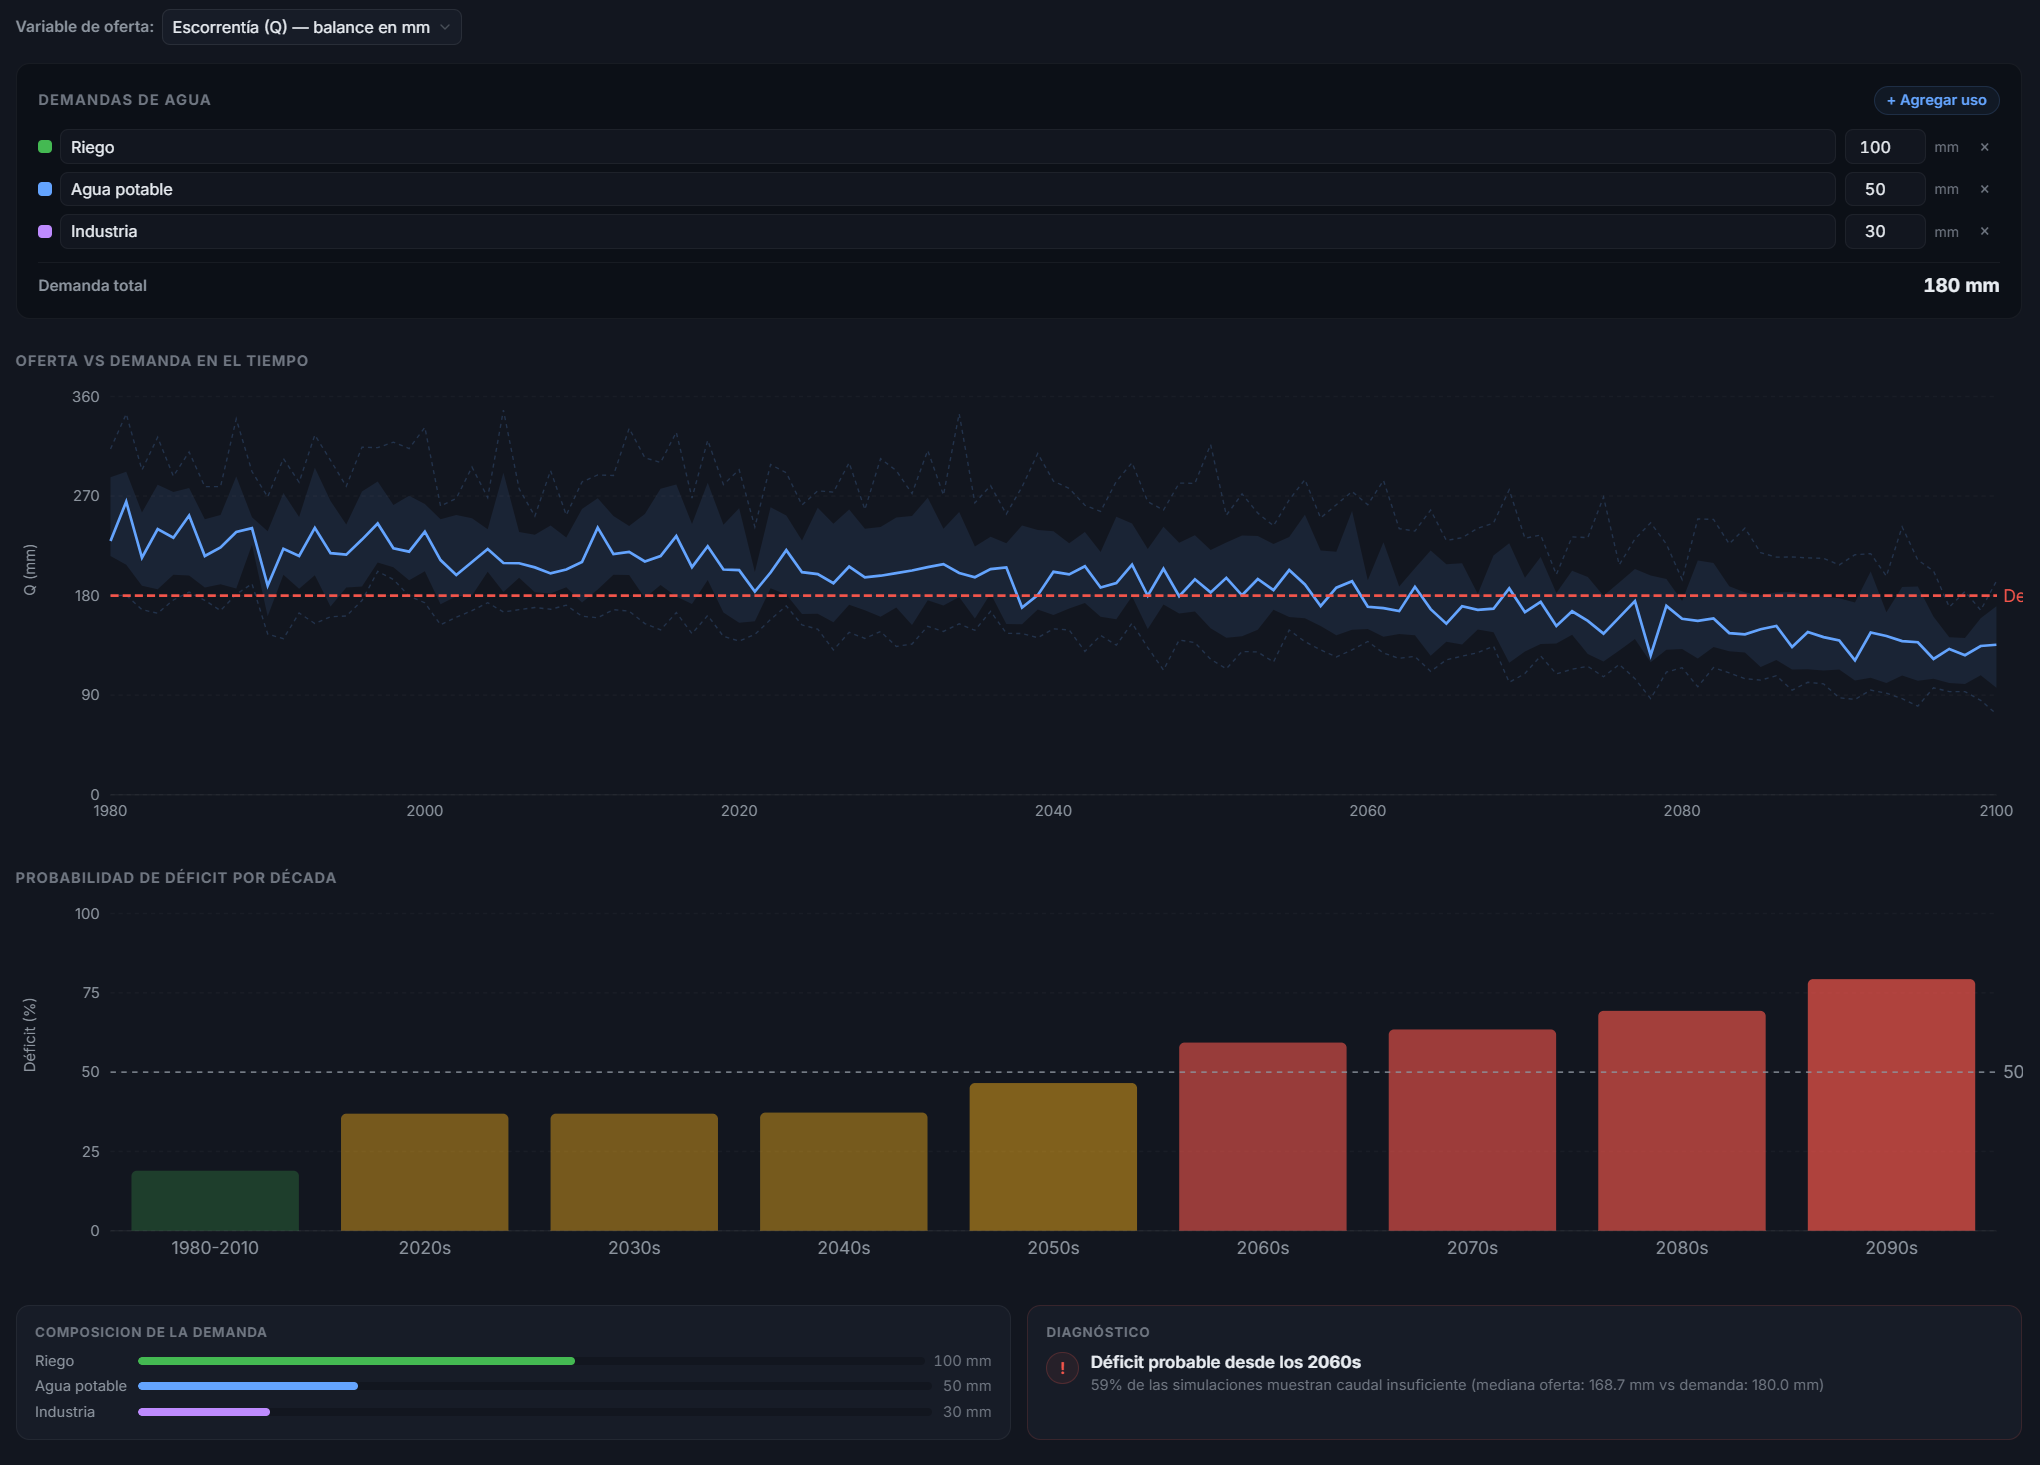
Evaluate how water supply in the watershed changes under different climate scenarios to support water planning.
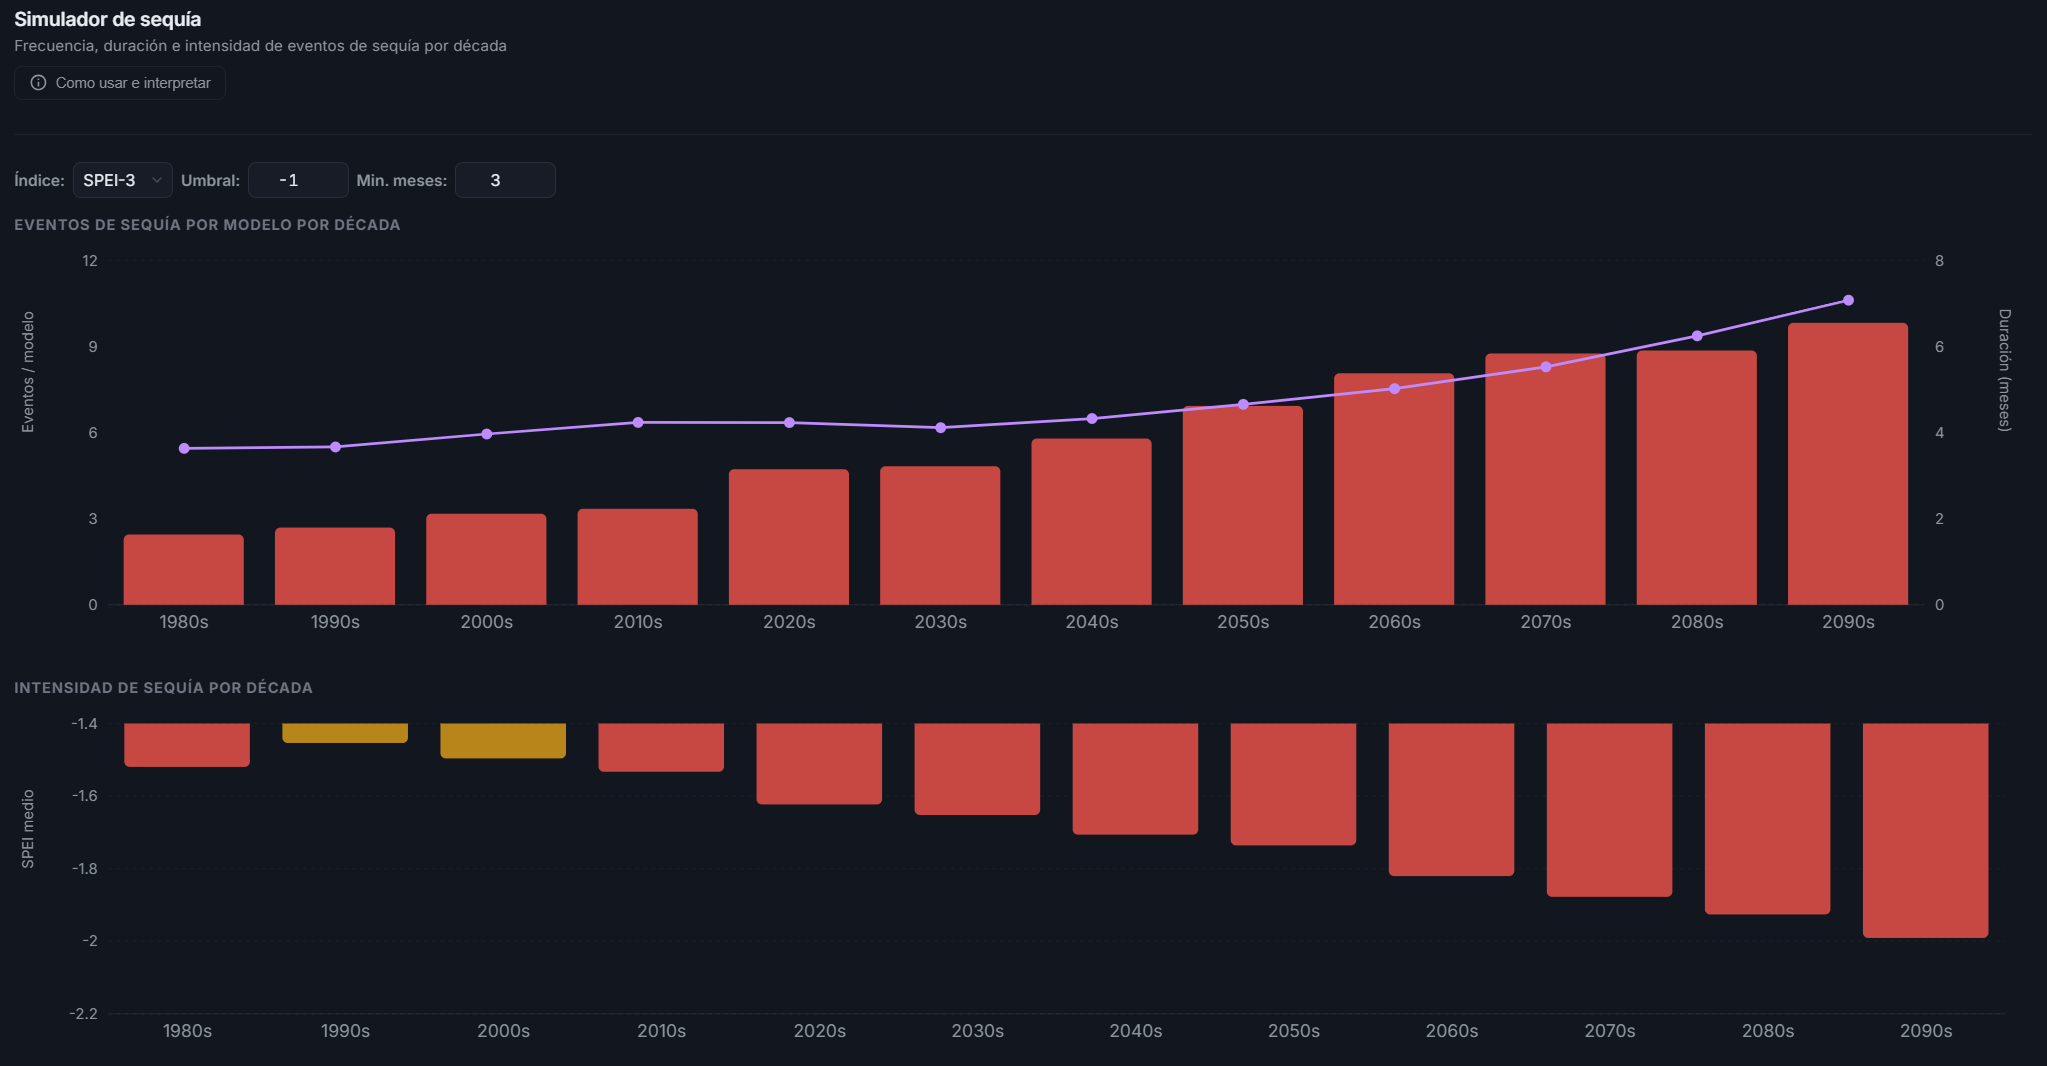
Analyze frequency, duration and intensity of drought events using SPEI indices at different time windows.
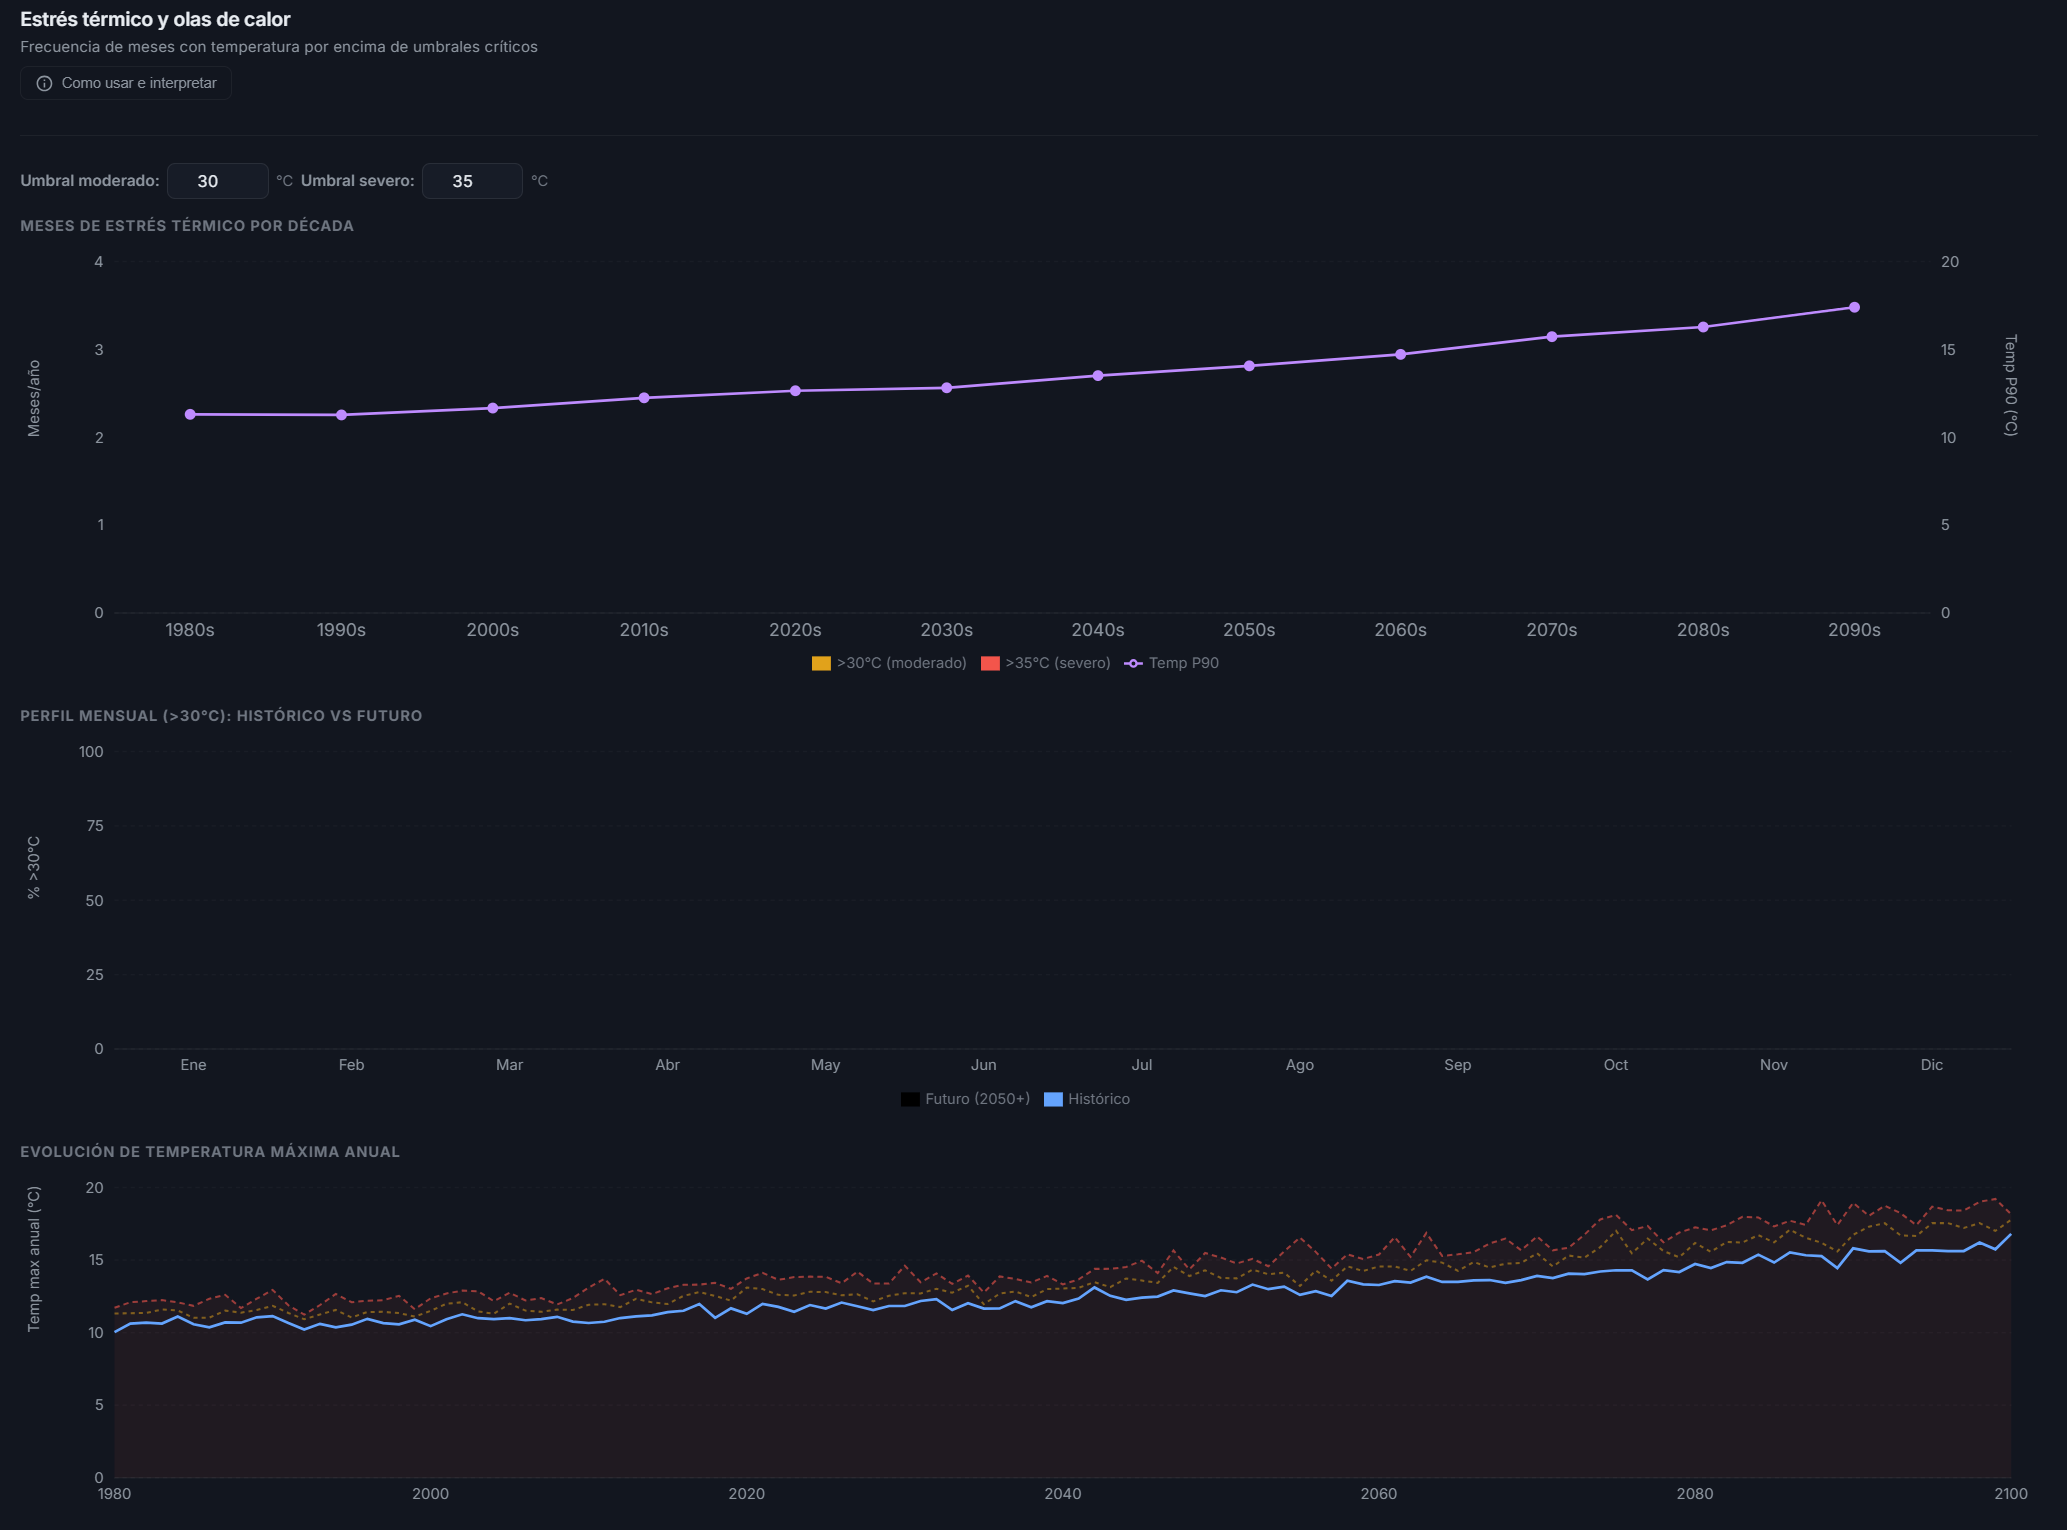
Project the evolution in frequency, duration and intensity of extreme heat events to support adaptation measures.
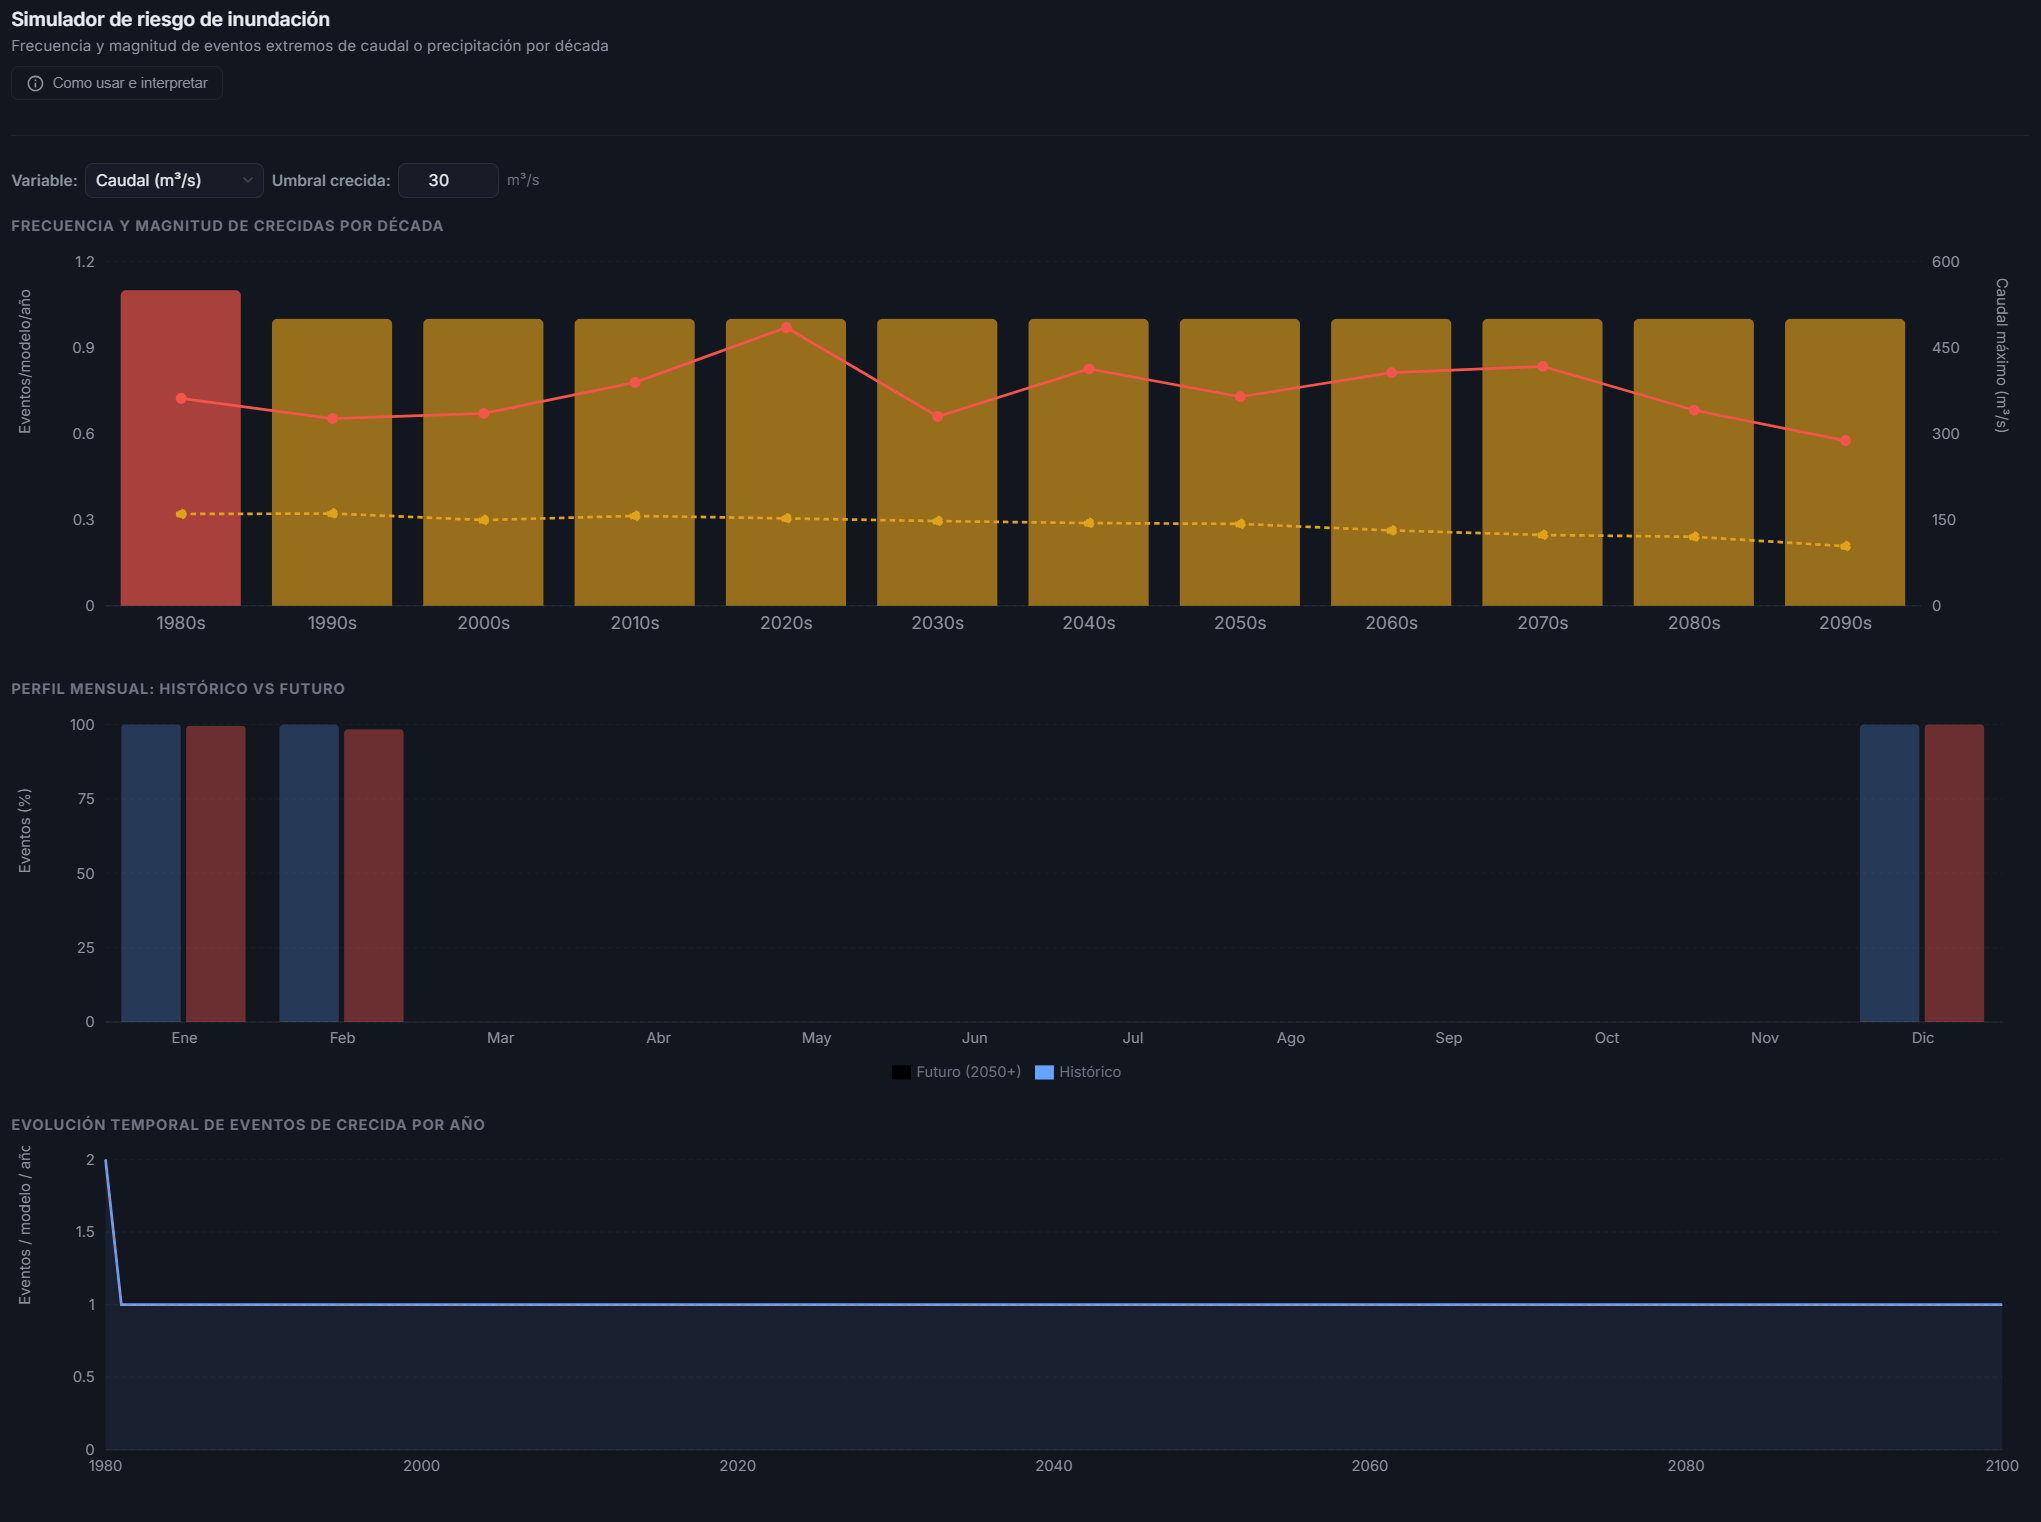
Explore changes in extreme precipitation events and return periods to assess future hydrological risk.
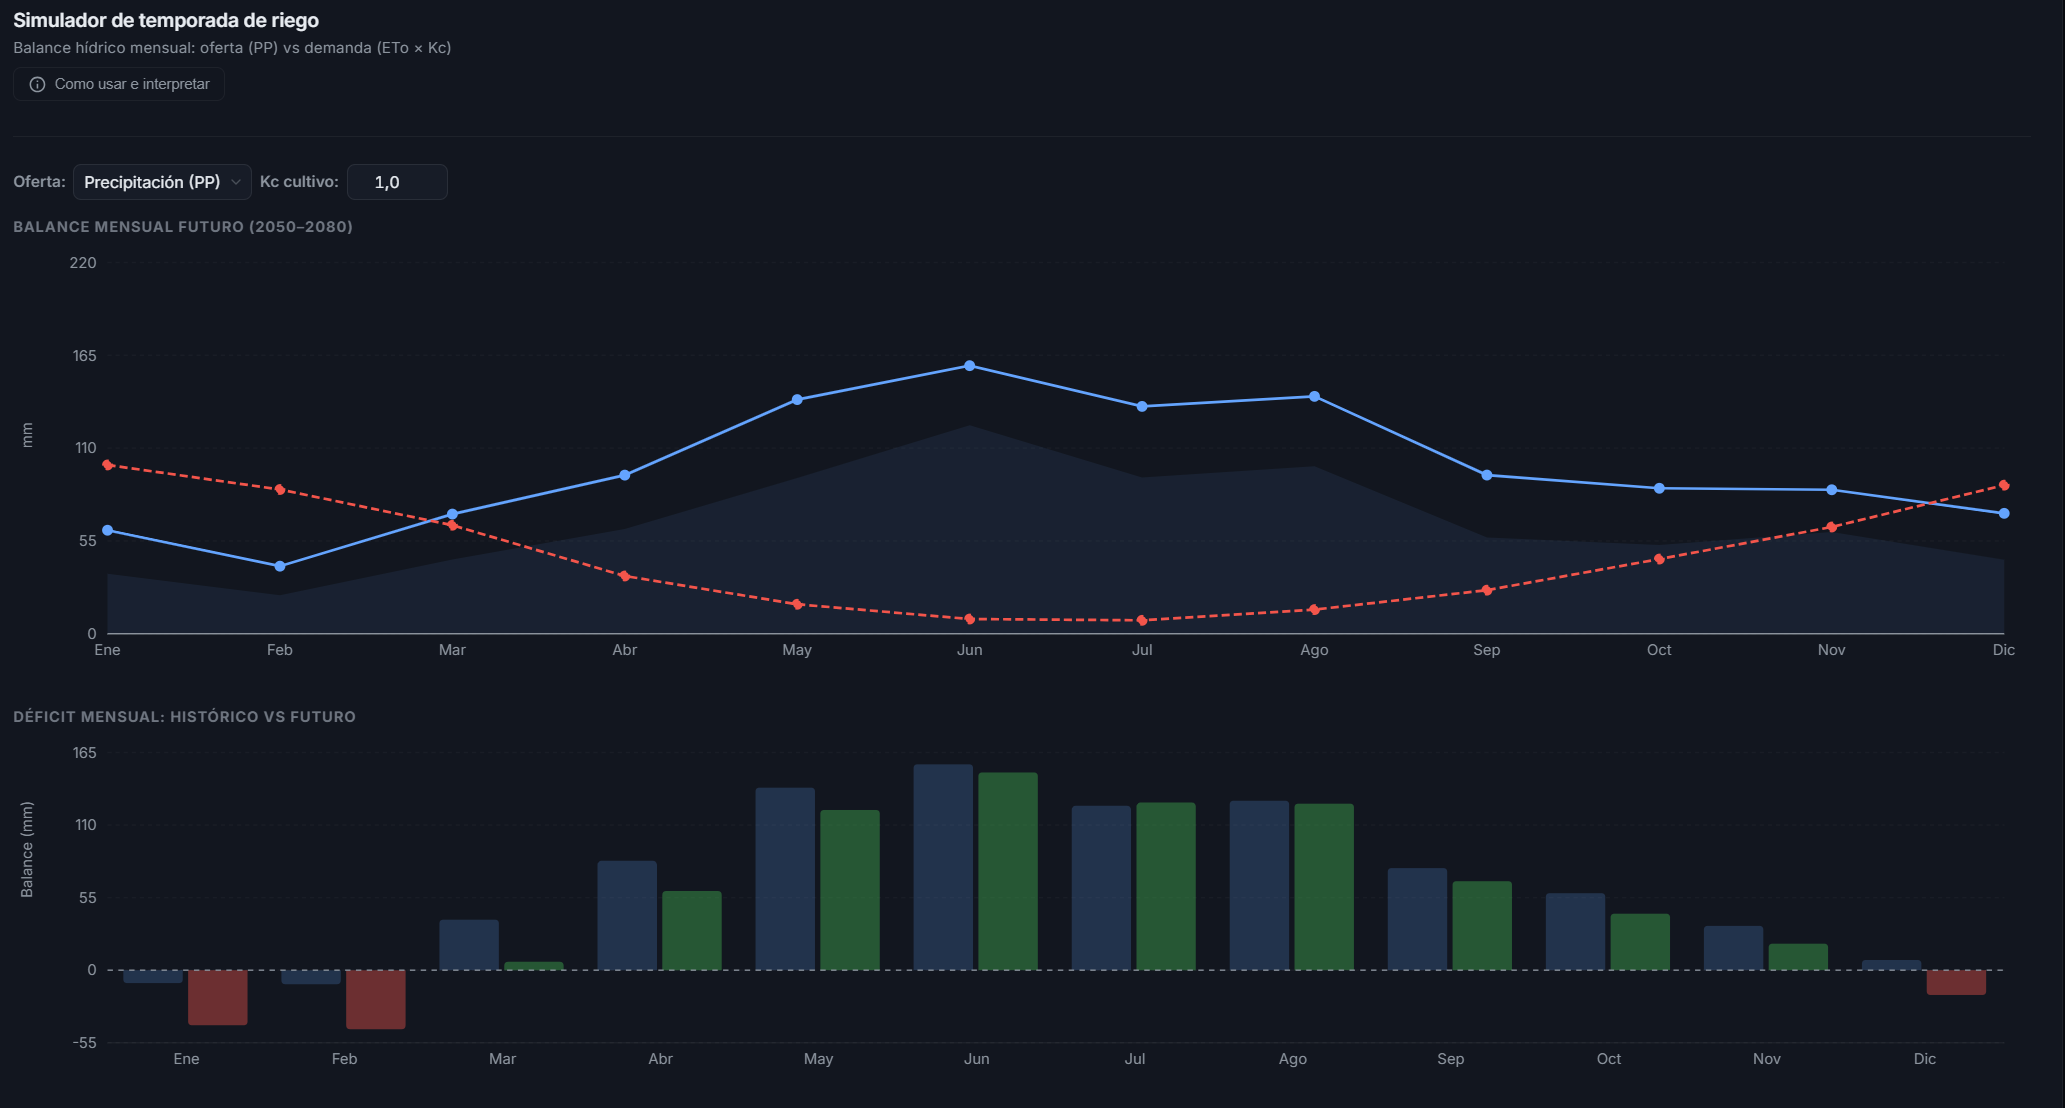
Analyze projected changes in the climatic window available for agricultural irrigation and seasonal water demand.
The platform includes other thematic simulators beyond those shown here — such as water balance, environmental flow, compound events, heat stress, wildfires and return period — and can be extended with custom simulators upon request for Enterprise plan clients.
The platform is organized into six modules that cover everything from initial exploration to applied simulation.
Consolidated view with the most relevant climate and hydrological indicators for the selected watershed.
Exploration of future climate and hydrological variables under different scenarios and time horizons.
Diagnostics with trends, anomalies and decadal changes to characterize how the climate evolves over time.
Direct comparison between SSP scenarios to measure magnitude, uncertainty and divergence across trajectories.
Contrast between different watersheds to identify where projected changes are most intense or relevant.
Applied thematic simulators: water availability, droughts, floods, heat waves, irrigation and more.

Projections and metrics ready to explore, compare and export for each watershed.
Organizations that need to assess climate sensitivity and support territorial or productive planning.
Teams looking to strengthen studies and analyses with a modern and applied platform.
Agencies and governments working on adaptation, planning and territorial management.
Groups that need to explore scenarios and communicate results clearly.

Every simulation is backed by methodological frameworks used in the scientific literature and in standard practice across the international climate community.
Multi-model ensembles from the sixth IPCC cycle under multiple SSP scenarios.
Projections adjusted with local observations to capture actual climate behavior at the watershed scale.
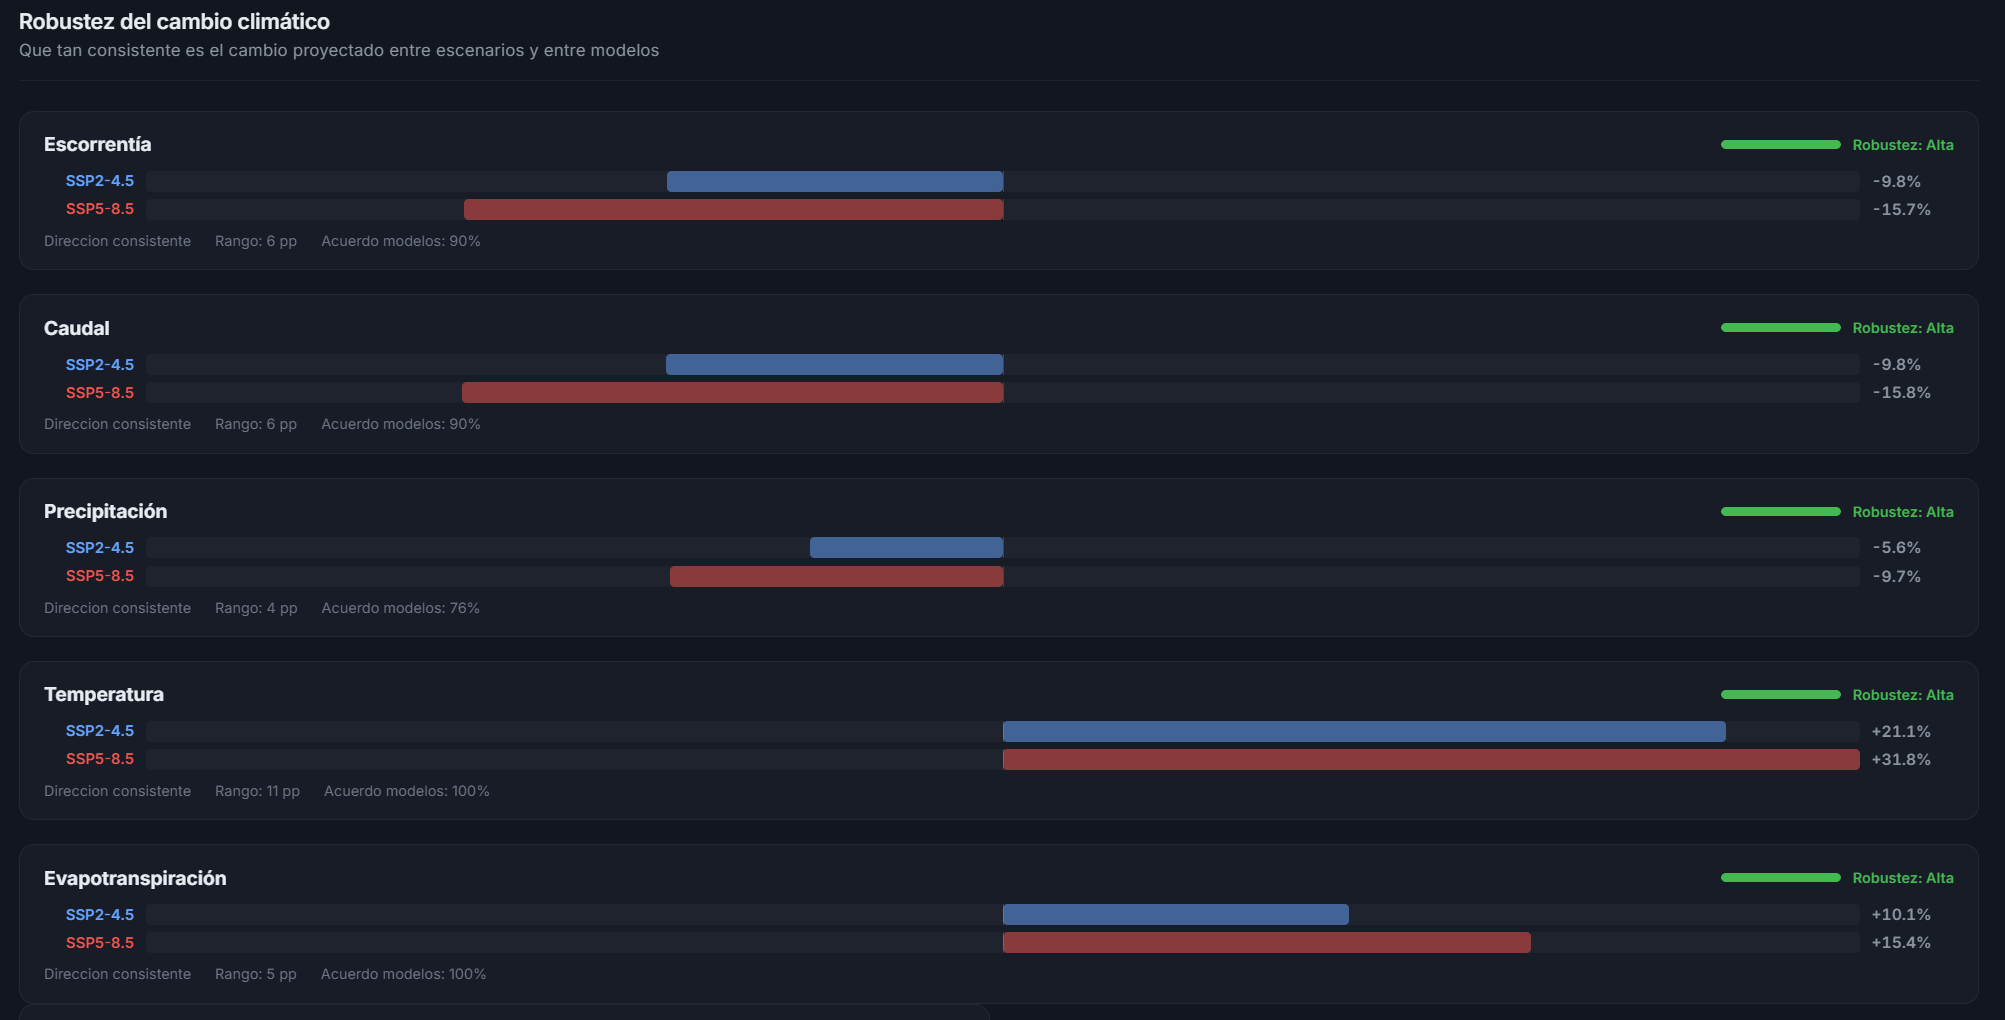
Inter-model agreement, ranges and robustness made explicit — not a single projection line.
New data, watersheds and modules are integrated at no extra cost during your subscription.
Climate Change Explorer evolves together with those who use it. We listen to each client's feedback so the platform improves over time and delivers results that are increasingly accurate and aligned with their needs.
Every client has a direct channel to propose improvements, report needs and prioritize what brings the most value.
We incorporate fixes, new modules and methodological improvements continuously, without disrupting platform use.
Results become more accurate and relevant for each context, sector and watershed over time.
Pick the access level that best fits your organization. No mandatory commitment — cancel anytime.
Prices in USD · Taxes not included
Pro · Consultant
Ideal for independent professionals and consultants.
USD 189/month
or USD 990 / 6 months · USD 1,890 / year
Business · Company
For teams analyzing multiple watersheds on a regular basis.
USD 499/month
or USD 2,690 / 6 months · USD 4,990 / year
Enterprise · Institutional
Ministries, public agencies and large organizations.
Custom
Price based on scope and coverage.
No commitment
Cancel anytime, no fine print.
Receipts and invoices
Bank transfer, card or institutional billing.
Secure data
Encrypted infrastructure. Your analyses stay private.
Human support
We respond in hours, not days. In English and Spanish.
A typical consultancy delivers a static report in weeks or months, with a high fixed cost. The platform delivers unlimited, repeatable and updatable analyses for a fraction of the cost. It doesn't replace expert judgment when it's needed, but it removes the repetitive work of extracting and visualizing projections.
Coverage is actively expanding. If your watershed isn't available yet, we can prioritize its integration as part of onboarding — contact us to review the specific case.
Yes. We offer a free guided demo where we walk through the platform with your real use case. If you need a longer technical evaluation, we can arrange trial access.
The fee includes full access to the subscribed plan, updates, new data and watersheds added over time, and support according to plan level. There are no fees for additional analyses or overconsumption. Prices are quoted in USD and taxes are not included.
Monthly, 6-month and annual options are available (with discounts for upfront payment). There is no mandatory term — you can cancel anytime. Annual plans have preferential pricing.
The platform is based on multi-model CMIP6 ensembles under multiple SSP scenarios, with bias correction and downscaling to Chilean geography. Uncertainty metrics and inter-model agreement are shown explicitly so every analysis remains scientifically interpretable.
Yes. On Business and Enterprise plans, Boreal Austral can develop modules, simulators or integrations according to the client's needs (e.g. custom indicators, internal formulas, integration with existing systems).
We issue electronic invoices and can adapt to public procurement and tender processes. The Enterprise plan is specifically designed for institutional billing and multi-user licensing.
All plans include email support. Business adds priority support and onboarding. Enterprise includes team training, SLA and dedicated support.